
Speed Limits: How They're Set and Why They Matter
The Sign You Pass Every Day
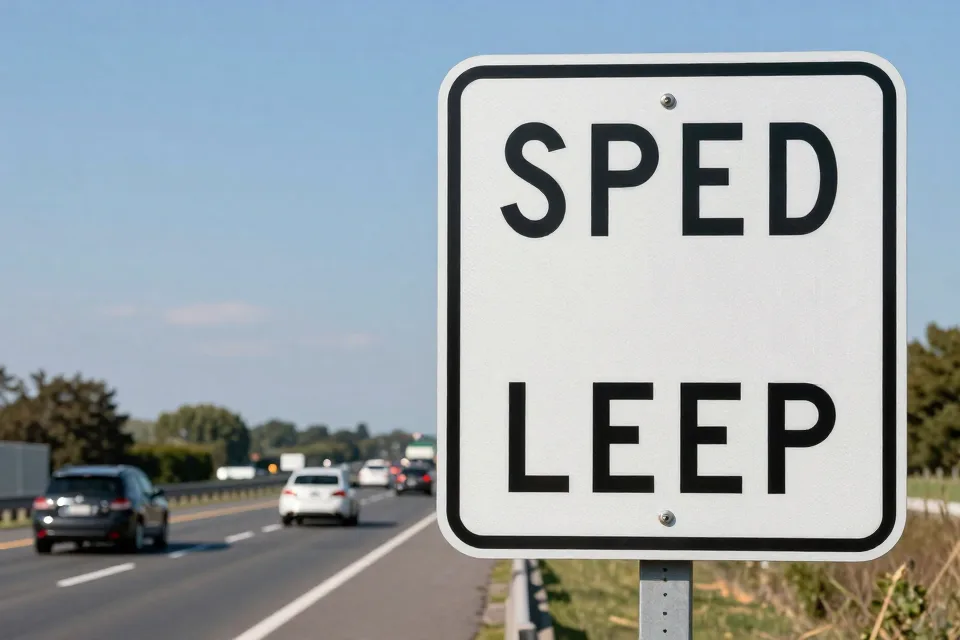
You pass a speed limit sign on nearly every trip, yet most of us give it almost no thought. It is just a number on a white rectangle, part of the roadside furniture. Some drivers treat it as a suggestion. Others suspect it is a ticket-revenue scheme. A few insist the limit exists only to catch them when they are not paying attention.
None of that is quite right. In the United States, a posted limit is the product of a deliberate engineering process — a number built from traffic measurements, crash records, road geometry, and local conditions. It is not perfect, and it is not the final word on what is safe. But it is far from arbitrary.
That distinction matters more as we get older. Vision, reaction time, and the body's ability to survive a crash all change with the years, so the gap between what a road permits and what your body can handle deserves a closer look. Here is how speed limits are really set, what the research says about why they matter, and where the numbers come from.
Who Sets Your Speed Limit — and How
Speed limits in the U.S. are not set by one federal agency. The authority belongs to states and local governments: elected officials, state departments of transportation, city councils, and sometimes police agencies all share the job. The federal role is mostly standardization. The Manual on Uniform Traffic Control Devices, or MUTCD, is the national rulebook for how signs look and how limits should be studied.
Before a number goes on a sign, most agencies run an engineering speed study. Engineers measure how fast traffic actually moves on that stretch of road, then weigh the measurements against crash history, curves and hills, nearby homes and driveways, and how many people walk or bike there. There is no single universal formula — different agencies balance these factors differently — but the result is based on measurement, not guesswork.
The 85th Percentile Rule, Explained Simply
One tool dominates the process: the 85th percentile speed. Engineers collect speed data on a road over a full day, then arrange every recorded speed from slowest to fastest. The 85th percentile speed is the number that 85 percent of drivers are going at or below — the pace the fast-but-reasonable majority settles on naturally. The Federal Highway Administration describes it as the speed that 85 percent of drivers stay at or under while traveling a given road.
The logic is practical. If the limit is set where most drivers already travel, most people comply without thinking about it, and enforcement targets a small group rather than the whole road. The MUTCD recommends that the posted limit stay within about 5 mph of the 85th percentile figure. Every state agency surveyed by the Federal Highway Administration reported using the 85th percentile speed, and limits are typically rounded to the nearest 5 mph increment.
Here is a simple example. Picture a two-lane road outside a small town. A speed study shows 85 percent of drivers travel at 43 mph or slower, even though the road curves and passes a handful of driveways. Engineers would likely post 40 or 45 mph — close to measured behavior. Now imagine the same road with a history of run-off-road crashes and several blind corners. Crash experience is allowed to pull the number down, in some states by up to 10 mph below the 85th percentile figure when conditions warrant.
What Engineers Weigh Besides Driver Behavior
The 85th percentile is the starting point, not the whole answer. A federal survey of state agencies shows how often each factor enters the decision:
| Factor | Share of state agencies that use it |
| --- | --- |
| 85th percentile speed | 100% |
| Roadside development (homes, businesses, driveways) | 85% |
| Crash history | 79% |
| Road geometry (curves, hills, lane width) | 67% |
| Pedestrian and bicycle volumes | 40% |
The federal government also offers a free web tool called USLIMITS2 that gives an objective second opinion, and local agencies without an in-house engineer use it often. Special limits get their own rules: most states post school-zone limits of 15 to 25 mph, and work-zone limits are built into each construction project's traffic control plan. Traffic engineers increasingly caution that no single measure should decide a limit — the 85th percentile describes how people drive, not necessarily how fast they should.
The Physics Behind the Numbers
Speed limits exist because physics does not negotiate. The crash energy that must be absorbed by a car, a guardrail, or a human body grows with the square of speed. The Federal Highway Administration's research synthesis puts the stakes bluntly: the risk of death rises with the change in impact speed to roughly the fourth power. A small increase in speed is not a small increase in danger — it is a large one.
Distance tells the same story. At 55 mph on dry pavement, a typical driver needs about 419 feet to stop after spotting a hazard — perception, reaction, and braking all added up, according to the Georgia Driver Services manual, which mirrors national driver-education material. That is roughly one and a half football fields. At 65 mph the car rolls about 140 feet in the second and a half it takes to react, before the brakes even begin to grab.
Reaction time is not a constant. Fatigue, distraction, darkness, and health all stretch it. And when speed doubles, the physics get ugly fast: doubling your speed quadruples both the braking distance and the impact force, a fact printed in commercial driver handbooks. A crash at 40 mph releases roughly four times the energy of a crash at 20 mph.

Speed and People: The Pedestrian Numbers
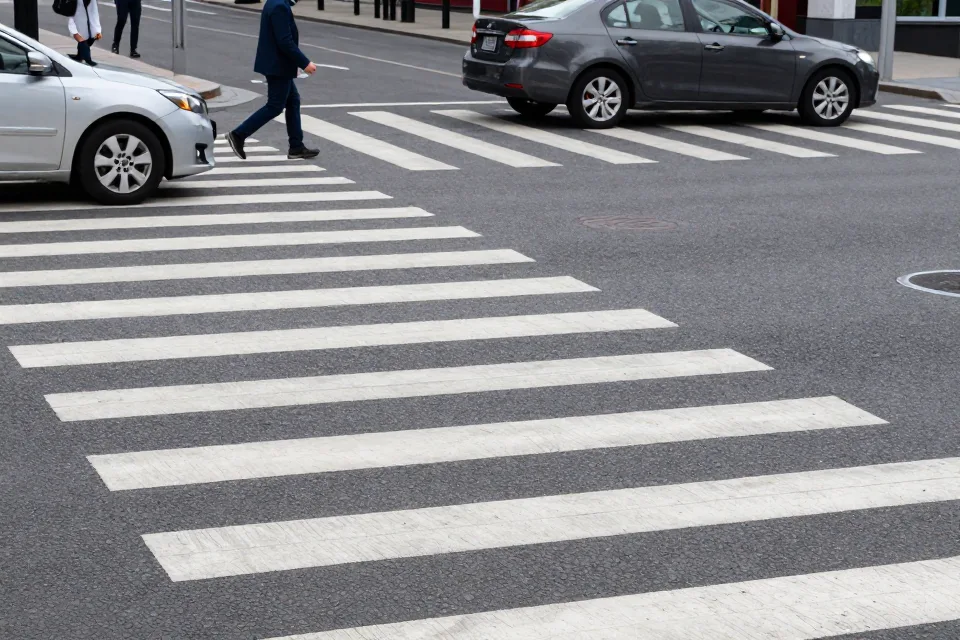
Limits matter most where people walk. The AAA Foundation for Traffic Safety studied real pedestrian crashes and mapped impact speed against injury risk. For a pedestrian who is hit, the typical chance of severe injury runs about 50 percent at 31 mph and 90 percent at 46 mph. The typical chance of death passes 50 percent near 42 mph. NHTSA notes that pedestrian risk climbs steeply once impact speeds pass roughly 20 to 25 mph.
| Impact speed | Average risk of severe injury | Average risk of death |
| --- | --- | --- |
| 16 mph | 10% | — |
| 23 mph | 25% | 10% |
| 31 mph | 50% | 25% |
| 39 mph | 75% | — |
| 42 mph | — | 50% |
| 46 mph | 90% | — |
| 58 mph | — | 90% |
Age cuts both ways in these numbers. The same study found that a 70-year-old pedestrian struck at a given speed faces a higher risk of severe injury or death than a younger adult hit at the same speed. Bodies heal more slowly as we age, which is worth remembering whether you are behind the wheel or on foot.
What Happens When Limits Go Up
The United States has run a decades-long natural experiment on this question. An IIHS study covering 1993 to 2017 found that each 5 mph increase in a state's maximum speed limit was tied to an 8.5 percent higher fatality rate on interstates and freeways. Over the whole period, the researchers estimated about 37,000 more deaths than would have occurred if maximum limits had stayed at 1993 levels.
Lowering limits works in the other direction. When Seattle cut its default arterial limit from 30 to 25 mph, crashes involving deaths or serious injury fell by 11 to 20 percent on those roads, according to an IIHS study. NHTSA's review of international research found similar patterns — crash reductions when urban limits dropped, including a U.K. city that lowered its citywide limit from 30 to 20 mph, and reductions of up to 60 percent on some rural roads where limits were reduced.
Where do speeding deaths actually happen? Not mostly on the interstate. About 55 percent of speeding-related deaths in 2024 occurred on roads with speed limits below 55 mph, and speeding played a role in a higher share of deaths on minor roads (33 percent) than on interstates and freeways (29 percent), according to IIHS fatality data. The limits that deserve your full attention are the ones near where you live.
A Brief History: The Great 55 mph Experiment
In January 1974, in response to the Arab oil embargo, President Nixon signed a law making 55 mph the national maximum speed limit. The goal was fuel conservation, and the fuel savings were real. Traffic deaths also fell sharply — 54,052 people died on U.S. roads in 1973 versus 45,196 in 1974, a drop of about 16 percent, though researchers debate how much of the decline came from the limit itself and how much from the recession and the gas shortage.
Congress kept the 55 mph law in place for more than two decades, then repealed it in November 1995, handing speed-limit authority back to the states. Several states quickly raised rural interstate limits to 70 mph or more. The years since have given researchers a clear before-and-after picture: when maximum limits climb, travel speeds climb with them, and so do deaths.
The Hidden Fuel Bill at Higher Speeds
The fuel logic that created the 55 mph limit is still sound. Gas mileage falls off sharply above about 50 mph, and the federal fuel-economy program estimates that every 5 mph over 50 is like paying an extra 29 cents per gallon. Cruise at 75 instead of 65 on a long trip and you can feel it at every fill-up.
AAA's instrumented testing found fuel-economy losses between 6.5 and 37 percent as speeds rose, depending on the vehicle, and slowing from 65 to 60 mph gained an average of about 3 mpg across the test fleet. Aggressive driving — speeding plus hard acceleration and braking — can cut highway mileage by 15 to 30 percent, according to fueleconomy.gov and Oak Ridge National Laboratory.
Common Mistakes Drivers Make About Speed Limits
Even experienced drivers build their habits around a few wrong assumptions. Here are the most common:
-
Treating the posted limit as a suggestion. The number on the sign is a legal maximum, not a target and not a floor. Exceeding it is a ticketable offense in every state, and penalties can grow with the excess.
-
Confusing legal with safe. The limit is set for ideal conditions. Rain, fog, darkness, heavy loads, and construction all call for slower speeds. NHTSA and IIHS count driving too fast for conditions as speeding even when you are at or below the posted limit.
-
Assuming a low limit is a money grab. Most posted limits come from engineering studies, not ticket revenue, and crash history or pedestrian traffic is usually why a number looks low. Limits set far below natural driving speeds also breed disrespect and are hard to enforce — the opposite of what the sign is for.
-
Thinking speeding saves real time. Do the arithmetic: a 20-mile trip at 70 mph instead of 60 mph saves about three minutes — less than one traffic light. A KBB review of the research concluded that raising limits does little to save time while adding crash risk.
-
Racing to keep up with the flow. Matching the pace of traffic is sensible, but pushing well beyond the median is not. Research shows crash risk climbs sharply for vehicles far above or below the average pace — in one federal synthesis, up to six times higher — and the speed gaps between cars are where crashes breed.
-
Ignoring the limits that matter most. School zones, work zones, and neighborhood streets carry the limits most likely to save a life. More than half of speeding-related deaths happen on roads posted below 55 mph, not on the interstate.
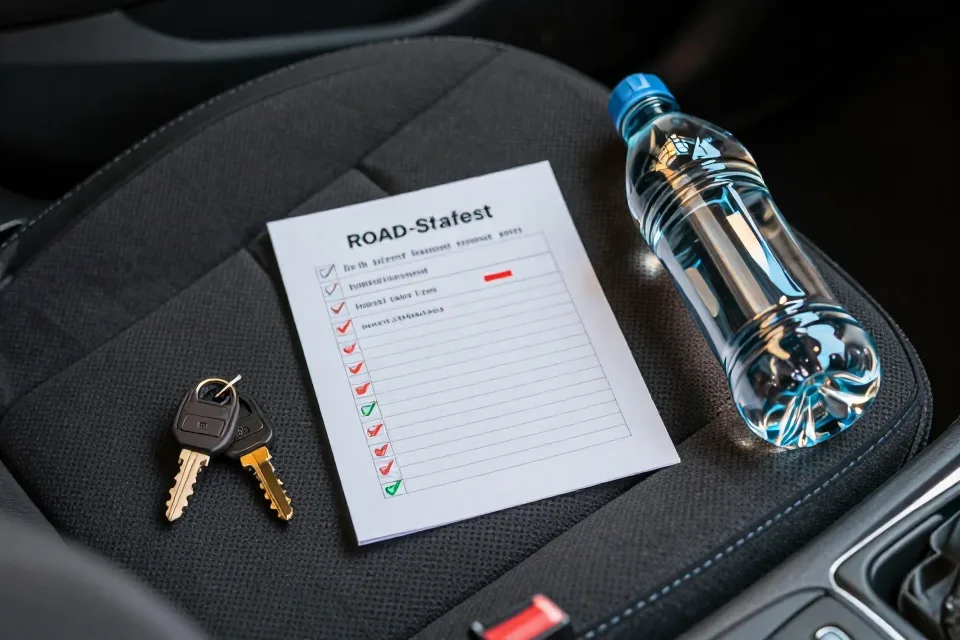
Your Speed-Limit Checklist
Before your next trip, run through this list:
-
Note where limits change on your route — they usually drop near towns, schools, and construction zones
-
Set cruise control at or just below the limit on open highways; it holds a steadier speed than your foot
-
In rain, fog, or darkness, drive below the limit and lengthen your following gap — the limit assumes ideal conditions
-
At highway speeds, give yourself the full stopping cushion: roughly 400 feet on dry pavement at 55 mph, and more when the road is wet
-
Ease off in school zones and neighborhoods, and expect people to step out from anywhere, not just at crosswalks
-
If you disagree with a limit, raise it at a public meeting — posted limits are changed through local processes, not by ignoring them
Speed limits will not make every road perfectly safe, and no number replaces judgment. But knowing how the number got there — and what the research says about the speeds we choose — makes you a better-informed driver.
The information in this article is general guidance, not legal advice or a substitute for the traffic laws in your state. For more on how we handle content, see our disclaimer.
Sources
- [authority] https://www.nhtsa.gov/risky-driving/speeding